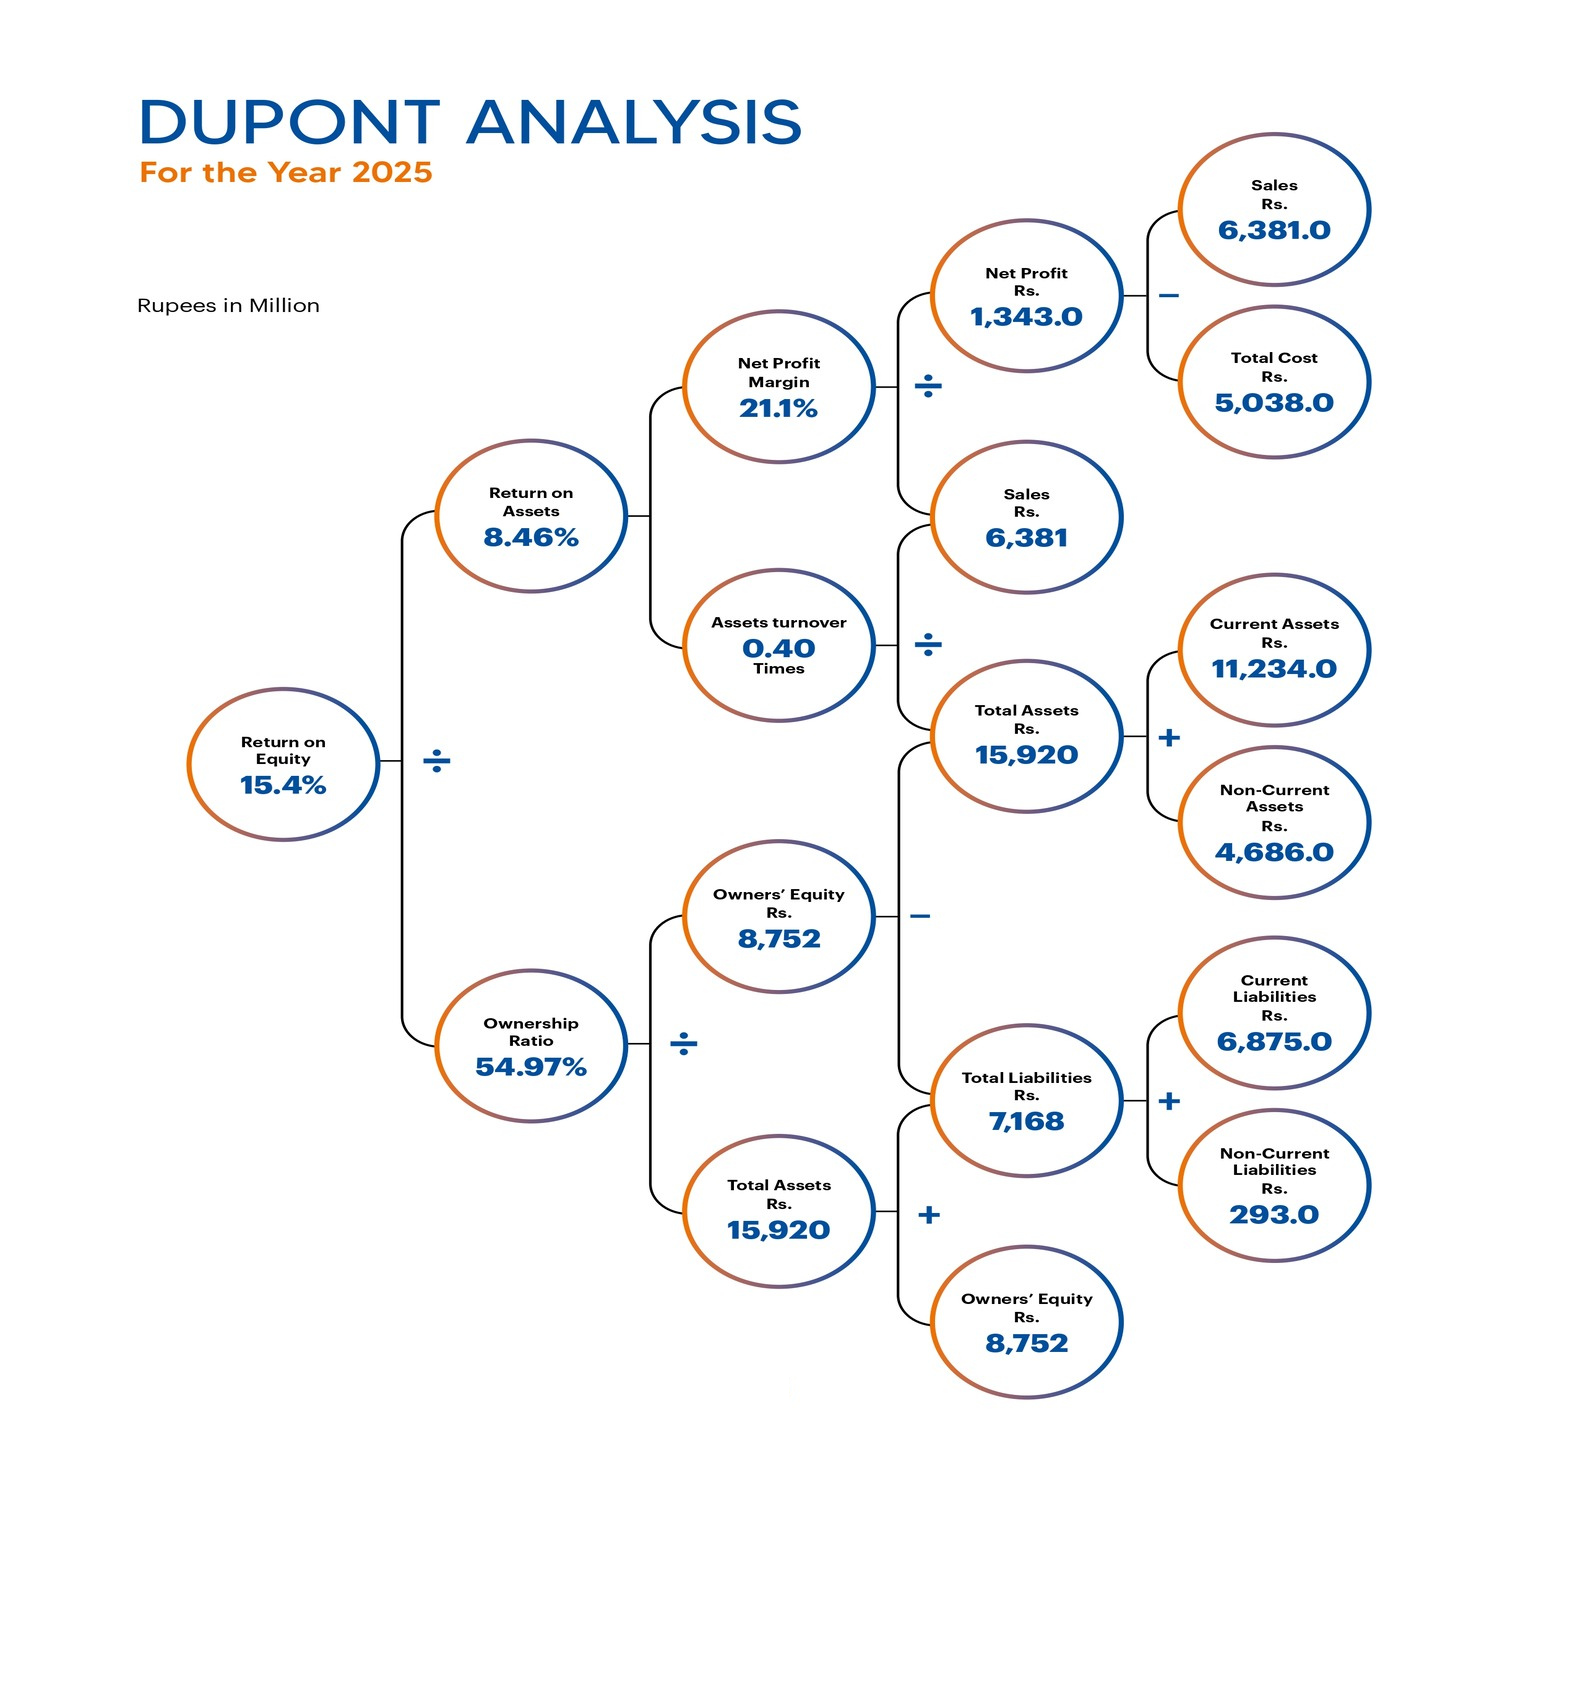
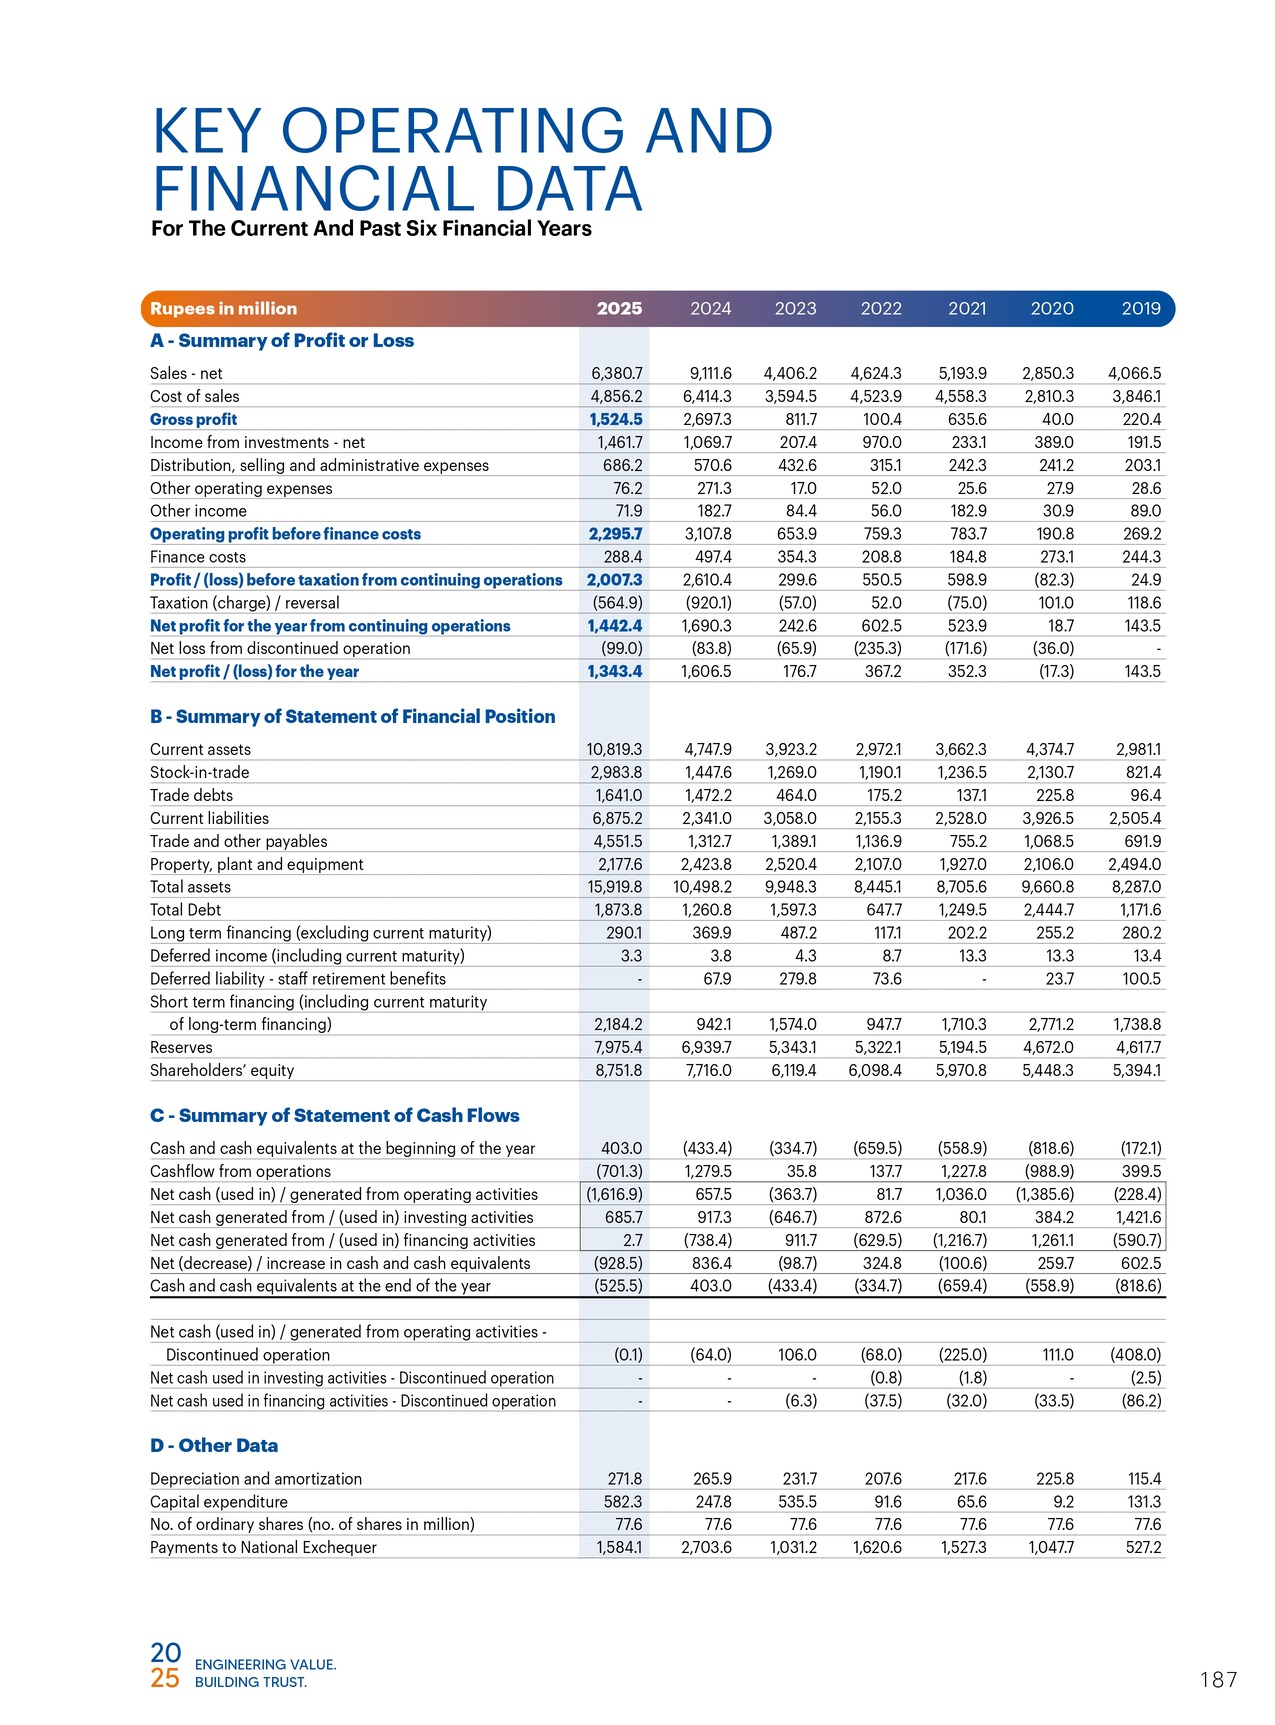
6,380.7
(PKR in million)
2,007.3
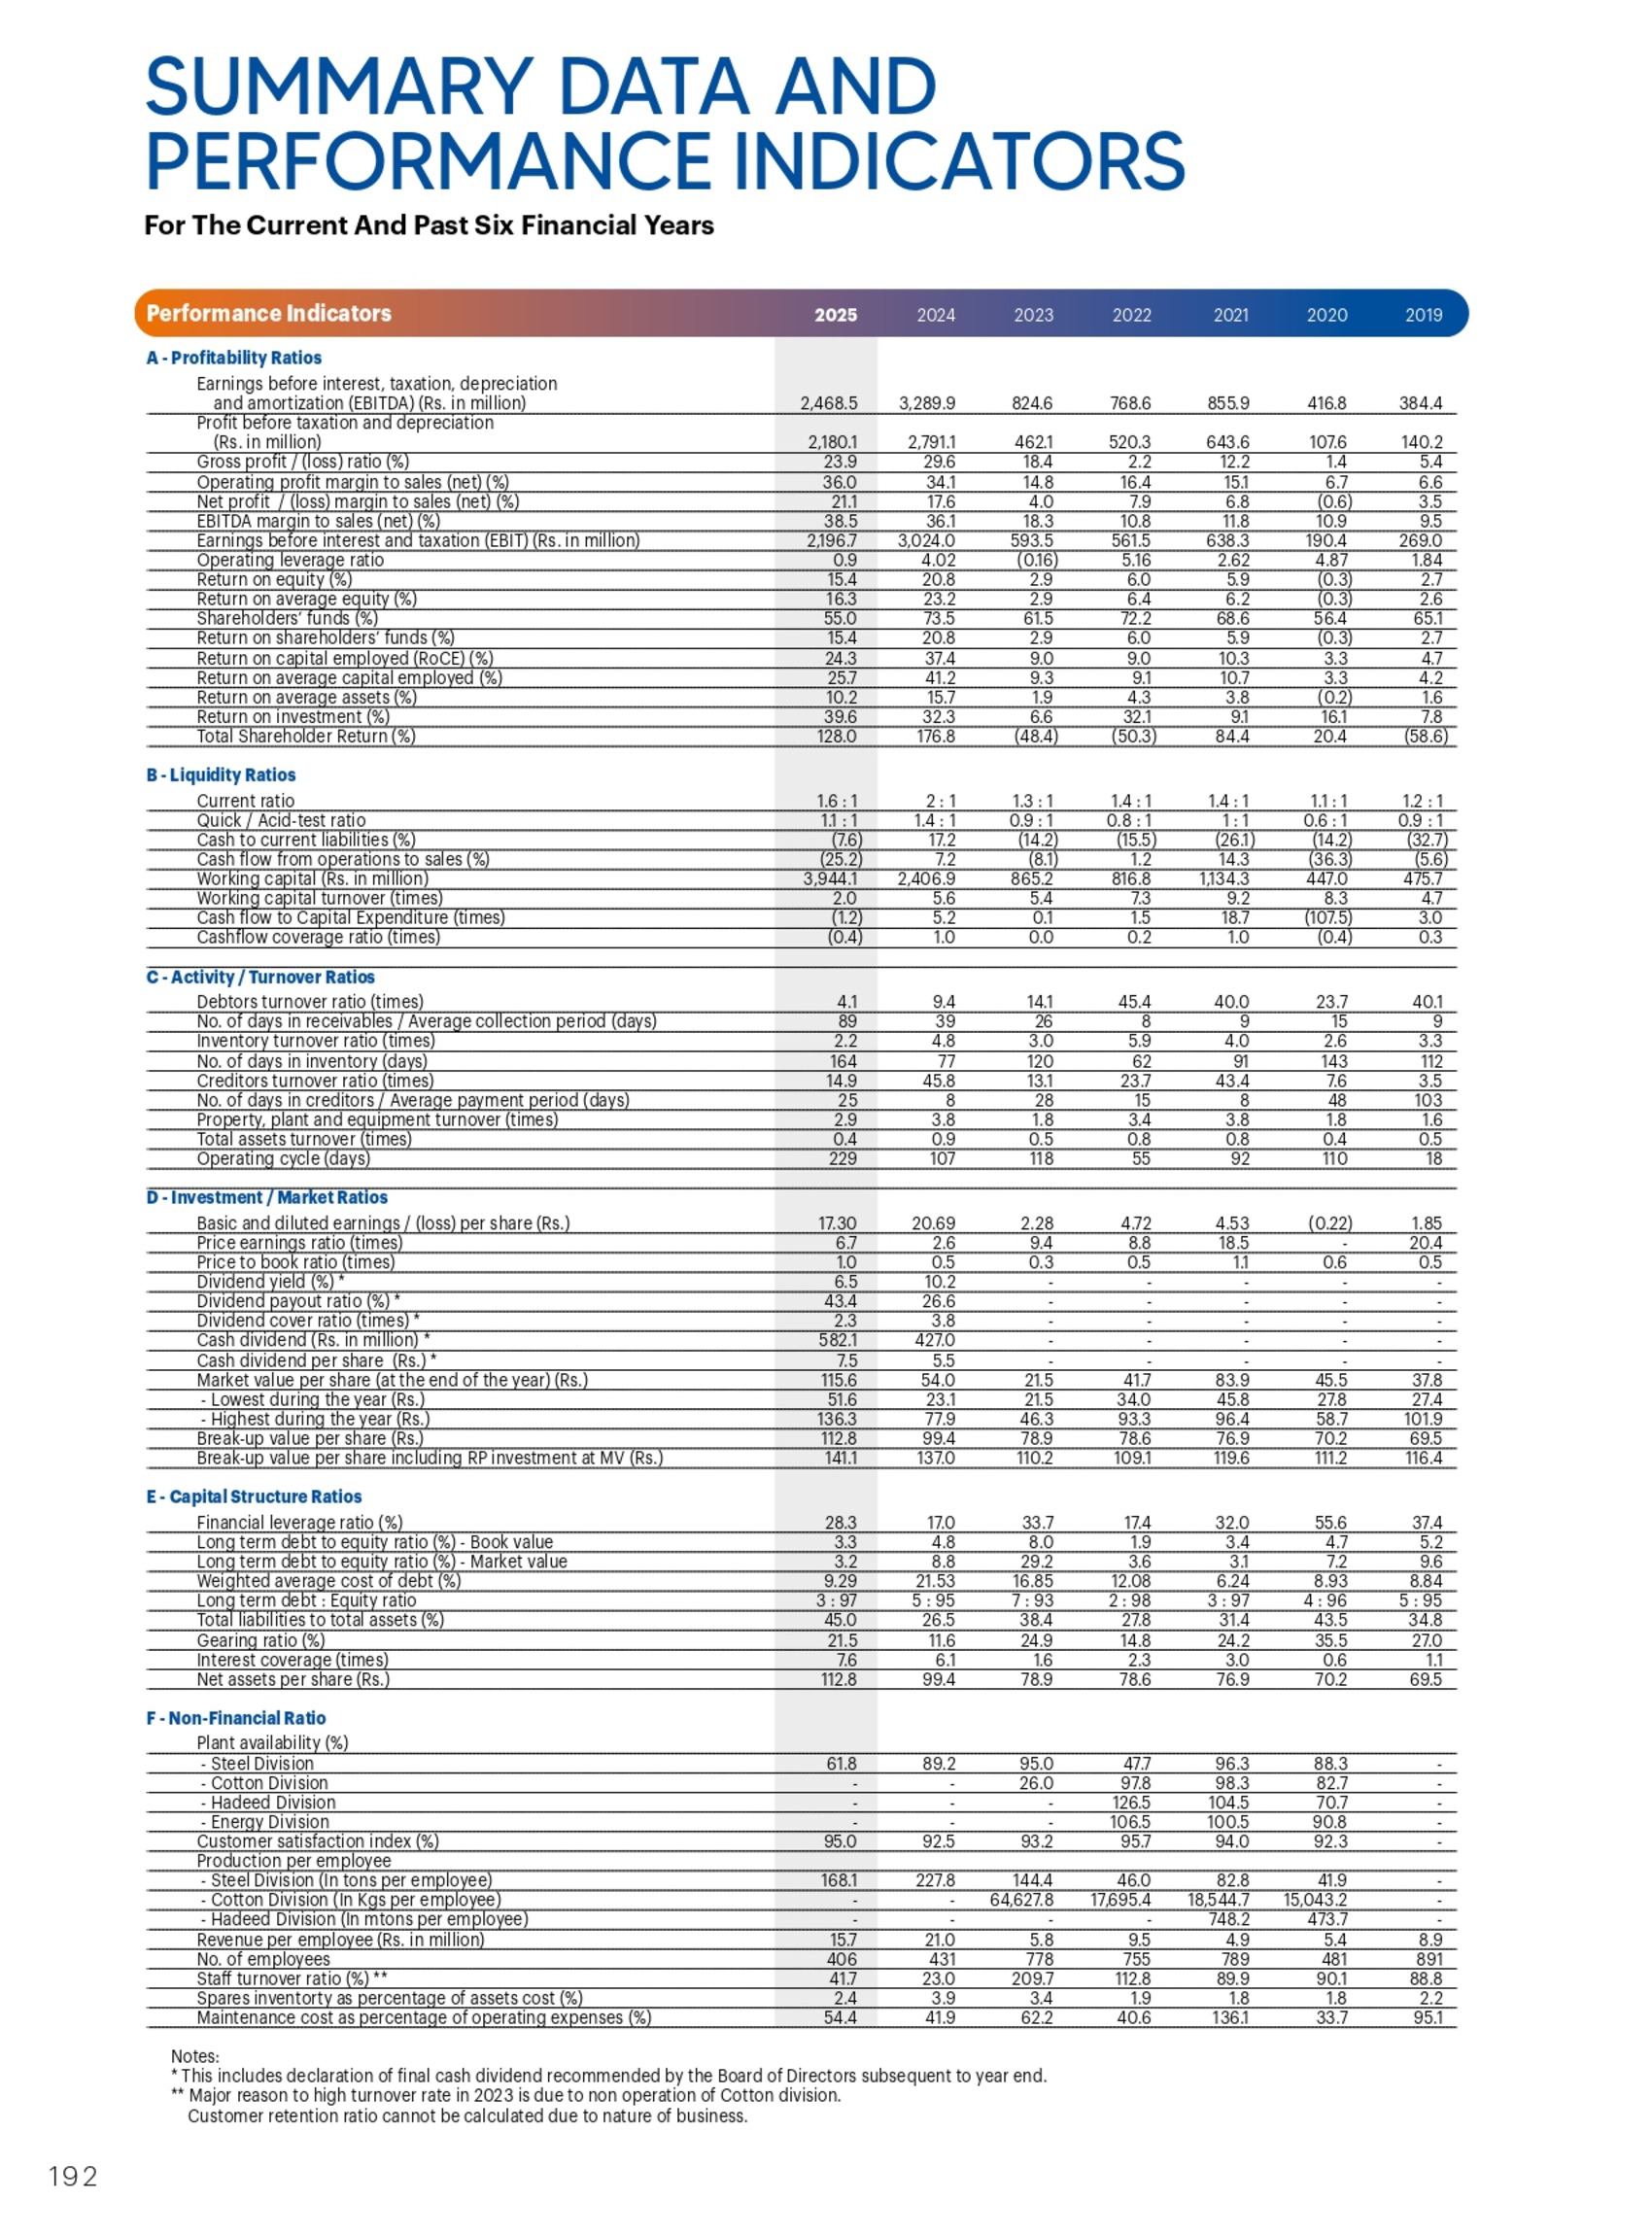
23.9%
21.10%
2,468.5
(Basic and Diluted)
17.30
(PKR per share)
15,919.9
8,751.8
582.3
112.8
(Including final proposed)
7.5
24.30%
21.50%
1.6 : 1
6.7
(Times)
115.63