
4,515.6
(PKR in million)
234.2
(PKR in million)
17.2%
3.9%
825.9
(PKR in million)
(Basic and Diluted)
2.28
(PKR per share)
9,948.3
(PKR in million)
6,119.4
(PKR in million)
535.5
(PKR in million)
78.9
(PKR per share)
(Including final proposed)
-
(PKR per share)
2.3%
24.9%
1.3:1
9.4
(Times)
21.5
(PKR per shares)
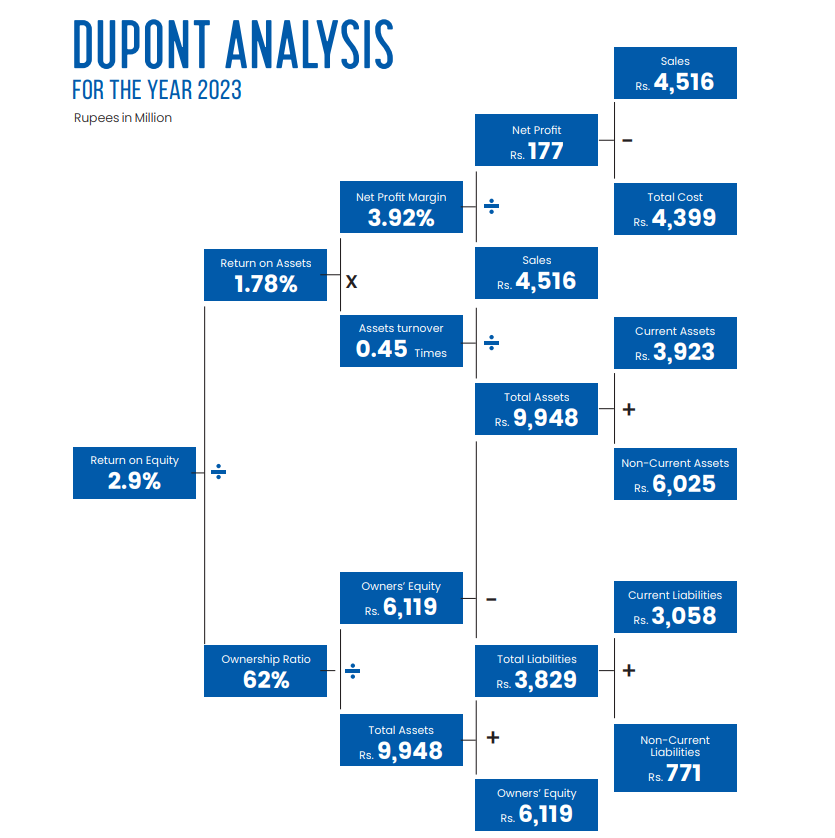
| DuPont Analysis | 2023 | 2022 |
|---|---|---|
| Tax burden | -24.5% | 16.4% |
| Interest burden | 153.6% | 78.1% |
| EBIT margin | 13.2% | 7.9% |
| Asset Turnover (times) | 0.5% | 0.8 |
| Leverage | 33.7% | 17.5% |
| Return on equity | 2.9% | 6.0% |
| Performance Indicators | Unit | 2023 | 2022 | 2021 | 2020 | 2019 | 2018 | 2017 |
|---|---|---|---|---|---|---|---|---|
| A - Profitability Ratios | ||||||||
| Earnings before interest, taxation, depreciation and amortization (EBITDA) | (Rs. In millions) | 825.9 | 768.9 | 855.0 | 416.9 | 384.6 | 1,308.4 | 1,682.0 |
| Profit before taxation and depreciation | (Rs. in millions) | 463.7 | 520.4 | 643.3 | 107.9 | 140.1 | 1,076.3 | 1,492.2 |
| Gross (loss) / profit ratio | (%) | 17.2 | (0.9) | 6.8 | 1.3 | 5.4 | 11.5 | 18.2 |
| Operating profit margin to sales (net) | (%) | 13.2 | 7.9 | 8.7 | 5.0 | 6.6 | 17.1 | 15.5 |
| Net profit / (loss) margin to sales (net) | (%) | 3.9 | 5.2 | 4.8 | (0.4) | 3.5 | 10.7 | 9.9 |
| EBITDA margin to sales (net) | (%) | 18.3 | 10.8 | 11.8 | 10.9 | 9.5 | 18.6 | 16.5 |
| Earnings before interest and taxation (EBIT) | (Rs. in millions) | 594.2 | 561.3 | 637.6 | 191.1 | 269.2 | 1,202.7 | 1,578.9 |
| Operating leverage ratio | (0.16) | 5.13 | 2.60 | 4.83 | 1.84 | 0.8 | 0.0 | |
| Return on equity | (%) | 2.9 | 6.0 | 5.9 | (0.3) | 2.7 | 11.2 | 14.8 |
| Return on average equity | (%) | 2.9 | 6.1 | 6.2 | (0.3) | 2.4 | 11.1 | 16.0 |
| Shareholders' funds | (%) | 61.5 | 72.2 | 68.6 | 56.4 | 65.1 | 66.7 | 56.0 |
| Return on shareholders' funds | (%) | 2.9 | 6.0 | 5.9 | (0.3) | 2.7 | 11.2 | 14.8 |
| Return on capital employed (RoCE) | (%) | 2.3 | 4.9 | 4.3 | (0.2) | 1.8 | 8.1 | 11.0 |
| Return on average assets | (%) | 1.9 | 4.3 | 3.8 | (0.2) | 1.6 | 6.8 | 9.3 |
| B - Liquidity Ratios | ||||||||
| Current ratio | 1.3 : 1 | 1.4 : 1 | 1.4 : 1 | 1.1 : 1 | 1.2 : 1 | 1.4 : 1 | 1.4 : 1 | |
| Quick / Acid-test ratio | 0.9 : 1 | 0.8 : 1 | 1 : 1 | 0.6 : 1 | 0.9 : 1 | 0.9 : 1 | 0.9 : 1 | |
| Cash to current liabilities | (%) | (14.2) | (15.5) | (26.1) | (14.2) | (32.7) | (5.8) | (4.7) |
| Cash flow from operating activity | (%) | (11.9) | 3.8 | 41.0 | (35.3) | (9.1) | 53.4 | 3.6 |
| Cash flow from operations to sales | (%) | (8.1) | 1.2 | 14.3 | (36.3) | (5.6) | 22.7 | 1.7 |
| Working capital - Net current assets | (Rs. in millions) | 865.2 | 816.8 | 1,134.3 | 448.2 | 475.7 | 1,248.1 | 2,096.1 |
| Working capital turnover | (times) | 5.4 | 7.3 | 9.2 | 8.3 | 4.7 | 4.2 | 5.8 |
| Cashflow to capital expenditure | (%) | 1,500 | 89.2 | 1,736.3 | (16,387.9) | (174.7) | 783.2 | - |
| Cashflow to coverage ratio | (%) | 0.0 | 7.7 | 54.2 | (46.2) | (11.3) | 81.8 | - |
| C - Activity / Turnover Ratios | ||||||||
| Debtors turnover ratio | (times) | 14.1 | 45.4 | 40.0 | 23.7 | 40.0 | 18.3 | 20.7 |
| No. of days in receivables / Average collection period | (days) | 26 | 8 | 9 | 15 | 9 | 20 | 18 |
| Inventory turnover ratio | (times) | 3.0 | 5.9 | 4.0 | 2.6 | 3.3 | 2.9 | 3.4 |
| No. of days in inventory | (days) | 120 | 62 | 91 | 143 | 112 | 124 | 108 |
| Creditors turnover ratio | (times) | 13.1 | 23.7 | 27.9 | 15.9 | 7.8 | 5.7 | 11.5 |
| No. of days in creditors / Average payment period | (days) | 28 | 15 | 13 | 23 | 47 | 64 | 32 |
| Property, plant and equipment turnover | (times) | 1.8 | 3.2 | 3.5 | 1.7 | 1.6 | 6.8 | 10.9 |
| Total assets turnover | (times) | 0.5 | 0.8 | 0.8 | 0.4 | 0.5 | 0.7 | 0.8 |
| Operating cycle | (days) | 118 | 55 | 87 | 136 | 74 | 80 | 94 |
| D - Investment / Market Ratios | ||||||||
| Basic and diluted earnings / (loss) per share | (Rs.) | 2.28 | 4.72 | 4.53 | (0.22) | 1.85 | 9.68 | 13.05 |
| Price earnings ratio | (times) | 18.3 | 8.8 | 18.5 | - | 20.4 | 9.4 | 18.3 |
| Price to book ratio | (times) | 0.3 | 0.4 | 0.7 | 0.4 | 0.4 | 0.7 | 1.5 |
| Dividend yield | (%) * | - | - | - | - | - | 2.2 | 2.2 |
| Dividend payout ratio | (%) * | - | - | - | - | - | 20.7 | 40.3 |
| Dividend cover ratio | (times) | - | - | - | - | - | 4.8 | 2.4 |
| Cash dividend | (Rs. in millions) * | - | - | - | - | - | 155.3 | 407.6 |
| Cash dividend per share | (Rs.) * | - | - | - | - | - | 2.0 | 5.3 |
| Market value per share (at the end of the year) | (Rs.) | 41.7 | 41.7 | 84.0 | 45.5 | 37.8 | 91.2 | 238.6 |
| - Lowest during the year | (Rs.) | 34.0 | 34.0 | 45.8 | 27.8 | 27.4 | 89.8 | 116.0 |
| - Highest during the year | (Rs.) | 93.3 | 93.3 | 96.4 | 58.7 | 101.9 | 229.4 | 283.1 |
| Break-up value per share | (Rs.) | 78.9 | 78.6 | 76.9 | 70.2 | 69.5 | 86.6 | 87.8 |
| Break-up value per share including RP investment at MV | (Rs.) | 89.1 | 88.5 | 97.1 | 90.1 | 95.5 | 124.5 | 143.6 |
| E - Capital Structure Ratios | ||||||||
| Financial leverage ratio | (%) | 33.7 | 17.5 | 32.0 | 55.5 | 37.4 | 29.1 | 45.2 |
| Long term debt to equity ratio – book value | (%) | 7.96 | 1.9 | 3.4 | 4.7 | 5.2 | 5.3 | 5.7 |
| Long term debt to equity ratio – market value | (%) | 15.1 | 3.6 | 3.1 | 7.2 | 9.6 | 5.0 | 2.1 |
| Weighted average cost of debt | (%) | 16.5 | 16.5 | 8.5 | 12.2 | 12.3 | 8.0 | 8.4 |
| Long term debt : Equity ratio | 7 : 93 | 2 : 98 | 3 : 97 | 4 : 96 | 5 : 95 | 6 : 95 | 6 : 95 | |
| Total liabilities to total assets | (%) | 38.4 | 27.8 | 31.4 | 43.5 | 34.8 | 33.2 | 43.9 |
| Gearing ratio | (%) | 24.9 | 14.8 | 24.2 | 35.5 | 27.0 | 21.3 | 31.0 |
| Interest coverage | (times) | 1.7 | 2.3 | 3.0 | 0.6 | 1.1 | 5.2 | 8.4 |
| Net assets per share | (Rs) | 78.9 | 78.6 | 76.9 | 70.2 | 69.5 | 86.6 | 87.9 |
| F - Employee Productivity Ratios | ||||||||
| Revenue per employee | (Rs. in millions) | 10.4 | 9.2 | 9.5 | 4.9 | 5.4 | 8.9 | 21.2 |
| Staff turnover ratio** | (%) | 209.7 | 111.1 | 89.9 | 90.1 | 102.2 | 97.7 | 140.7 |
| G - Others | ||||||||
| Spares inventory as percentage of assets cost | (%) | 3.4 | 2.0 | 1.9 | 1.8 | 1.7 | 2.2 | 1.7 |
| Maintenance cost as percentage of operating expenses | (%) | 15.3 | 8.3 | 7.7 | 6.9 | 5.7 | 9.0 | 13.5 |
Notes:
* This includes declaration of final cash dividend recommended by the Board of Directors subsequent to year end.
** Major contributor to high turnover rate is staff at the Cotton division’s spinning unit.
| Summarized Financial Data | 2023 | 2022 | 2021 | 2020 | 2019 | 2018 | 2017 |
|---|---|---|---|---|---|---|---|
| A - Summary of Profit or Loss (Rupees in millions) | |||||||
| Sales - net | 4,515.6 | 7,089.9 | 7,259.3 | 3,822.2 | 4,066.5 | 7,043.8 | 10,208.6 |
| Cost of sales | 3,739.7 | 7,155.2 | 6,762.5 | 3,771.3 | 3,846.1 | 6,232.5 | 8,349.8 |
| Gross (loss) / profit | 775.9 | (65.3) | 496.8 | 50.9 | 220.4 | 811.3 | 1,858.8 |
| Income from investments - net | 207.5 | 970.0 | 232.6 | 389.3 | 191.5 | 495.5 | 246.9 |
| Distribution, selling and administrative expenses | 451.7 | 341.4 | 260.8 | 258.6 | 203.1 | 190.9 | 317.8 |
| Other operating expenses | 16.8 | 63.5 | 27.4 | 25.9 | 28.6 | 84.9 | 410.8 |
| Other income | 79.3 | 61.5 | 196.3 | 35.4 | 89.0 | 171.7 | 201.8 |
| Operating profit before finance costs | 594.2 | 561.3 | 637.5 | 191.1 | 269.2 | 1,202.7 | 1,578.9 |
| Finance costs | 360.0 | 246.2 | 210.8 | 308.8 | 244.3 | 231.3 | 187.3 |
| Profit / (loss) before taxation | 234.2 | 315.1 | 426.7 | (117.7) | 24.9 | 971.4 | 1,391.6 |
| Taxation | (57.4) | 51.6 | (74.7) | 100.6 | 118.6 | (219.7) | (379.0) |
| Profit / (loss) for the year | 176.8 | 366.7 | 352.0 | (17.1) | 143.5 | 751.7 | 1,012.3 |
| B - Summary of Statement of Financial Position (Rupees in millions) | |||||||
| Current assets | 2,972.1 | 3,662.3 | 4,374.7 | 2,981.1 | 4,241.1 | 6,829.6 | |
| Stock-in-trade | 1,190.1 | 1,236.5 | 2,130.7 | 821.4 | 1,542.7 | 2,686.7 | |
| Trade debts | 175.2 | 137.1 | 225.8 | 96.4 | 106.9 | 663.7 | |
| Current liabilities | 2,155.3 | 2,528.0 | 3,926.5 | 2,505.4 | 2,993.0 | 4,733.5 | |
| Trade and other payables | 1,136.9 | 755.2 | 1,068.5 | 691.9 | 1,349.1 | 1,863.8 | |
| Property, plant and equipment | 2,216.8 | 2,058.9 | 2,274.3 | 2,493.7 | 1,039.0 | 940.6 | |
| Total assets | 8,445.1 | 8,705.6 | 9,660.8 | 8,287.0 | 10,079.0 | 12,179.6 | |
| Long term financing (excluding current maturity) | 117.1 | 202.2 | 255.2 | 280.2 | 354.2 | 386.1 | |
| Deferred income (including current maturity) | 8.7 | 13.3 | 13.3 | 13.4 | 13.5 | 11.6 | |
| Deferred liability - staff retirement benefits | 73.6 | - | 23.7 | 100.5 | - | 232.8 | |
| Short term financing (including current maturity of long-term financing) | 947.7 | 1,710.3 | 2,771.2 | 1,738.8 | 1,600.7 | 2,699.5 | |
| Reserves | 5,322.1 | 5,194.5 | 4,672.0 | 4,617.7 | 5,947.4 | 6,043.4 | |
| Shareholders' equity | 6,098.4 | 5,970.8 | 5,448.3 | 5,394.1 | 6,723.8 | 6,819.7 | |
| C - Summary of Statement of Cash Flows (Rupees in millions) | |||||||
| Cash and cash equivalents at the beginning of the year | (334.7) | (659.4) | (558.9) | (818.6) | (172.1) | (219.4) | (117.0) |
| Net cash generated from / (used in) operating activities | (363.7) | 81.7 | 1,036.0 | (1,385.6) | (228.4) | 1,599.5 | 172.0 |
| Net cash generated from / (used in) investing activities | (646.7) | 872.5 | 80.1 | 384.2 | 1,421.6 | 168.3 | (144.6) |
| Net cash (used in) / generated from financing activities | 911.7 | (629.5) | (1,216.7) | 1,261.1 | (590.7) | (1,720.5) | (129.8) |
| Net (decrease) / increase in cash and cash equivalents | (98.7) | 324.8 | (100.6) | 259.7 | 602.5 | 47.3 | (102.4) |
| Transfer upon amalgamation | - | - | - | - | (1,249.0) | - | - |
| Cash and cash equivalents at the end of the year | (433.4) | (334.6) | (659.5) | (558.9) | (818.6) | (172.1) | (219.4) |
| D - Other Data (Rupees in millions) | |||||||
| Depreciation and amortization | 231.7 | 207.6 | 217.5 | 225.8 | 115.4 | 105.7 | 103.0 |
| Capital expenditure | 535.5 | 91.6 | 65.6 | 9.2 | 131.3 | 204.2 | 215.2 |
| No. of ordinary shares (no. of shares in millions) | 77.6 | 77.6 | 77.6 | 77.6 | 77.6 | 77.6 | 77.6 |
| Payments to National Exchequer | 1,020.5 | 1,620.6 | 1,527.3 | 1,047.7 | 527.2 | 1,868.9 | 2,574.3 |